Statistically Speaking: Watson's rookie campaign compares favorably to Cam Newton |
Deshaun Watson looked like a steal for the Texans. Houston traded up with the Browns for the privilege of selecting Watson in the 2017 NFL Draft and paid a hefty price giving Cleveland a 2017 1st-round pick, and a 2018 1st-round pick. Houston GM Rick Smith met with Watson to work out before the draft and came away feeling like he could be their future franchise quarterback.
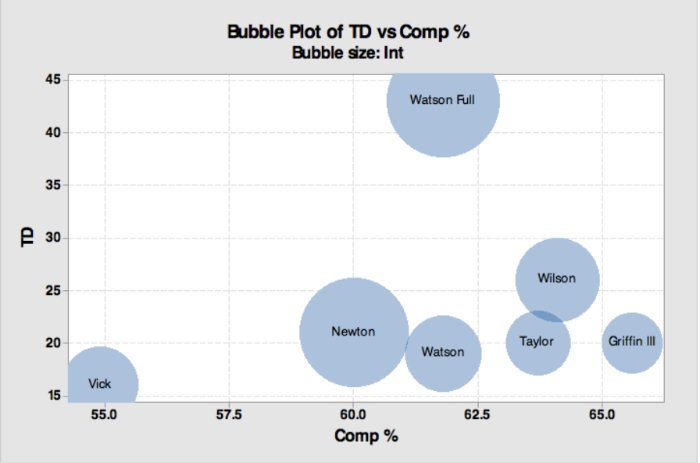
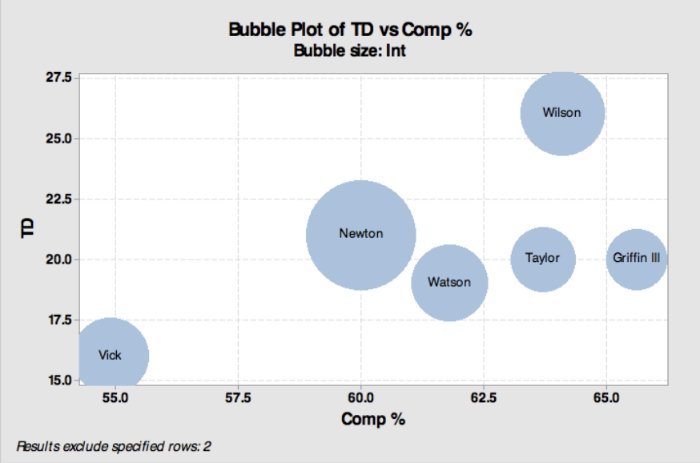
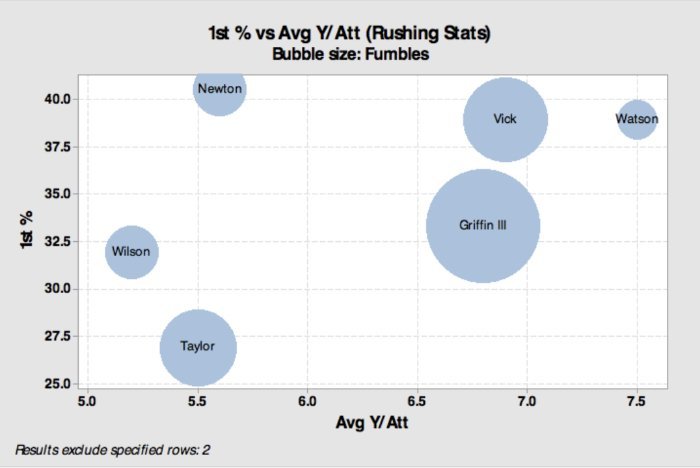
It took just half of a game before Watson saw his first NFL action. He replaced Tom Savage at halftime against the Jacksonville Jaguars in the season opener and nearly brought them back. After a rocky start against the Bengals, Watson went on a torrid pace. If not for a torn ACL, he very likely would have unanimously gotten the Rookie of the Year award. Let’s take a look at how he fared against other QBs with similar skill sets. All quarterbacks being compared have had the stats from their first full year compiled. Tyrod Taylor didn’t see a full season of playing time until 2015 and Michael Vick didn’t start a full season until his second year in 2002. Just looking at the raw data, Watson’s extrapolated numbers look closest to Cam Newton’s. In 2011, Newton took the NFL by storm winning the Rookie of the Year award and he took Eli Manning’s in the Pro Bowl after the Giants advanced to the Super Bowl. The difference between him and Watson is a little known advanced statistic called DVOA. It stands for Defense-adjusted Value Over Average. Simply put, it calculates a team or, in this case, player’s success rate on plays in a given game situation compared to the average player at the same position. Watson racked up a 23.3% DVOA compared to Newton’s 0.8%. For context, Tom Brady had a DVOA of 27.9% in 2017. Playing anywhere near Tom Brady is always a good thing. The notable difference between all of the QBs and Watson is that Watson’s full-season data was extrapolated from just seven games. Seven is not enough to make an accurate prediction and assumes he would have stayed on the same pace for the rest of the season in all statistics. This is ludicrous especially given his touchdown percentage. Brady never had more than 8.7 percent in one season and averaged 5.5 over his career. Furthermore, no quarterback other than Watson had their season taken from a set of less than 14 games which is double how many Watson played in. A regression in his 2018 numbers is almost certain, but this is the best approximation we can assume without taking into account strength of schedule. I put together a bubble chart comparing completion percentage to touchdowns and interceptions. The size of the bubble is the amount of interception each quarterback threw. I used these three stats because they most heavily weigh into scout evaluations of prospects before the draft and are the biggest factors in terms of early career success. The best outcome would be to be placed in the top right with a tiny bubble. Looking at the graph it’s easy to see that Watson’s extrapolated numbers are a major outlier. Most of the quarterbacks land near the bottom right of the graph indicating high completion rates, but low touchdowns. It also highlights how much of Watson’s extrapolated data is an outlier. If he stayed at the same rate he was at, he would have outperformed the other quarterbacks by an exhaustive amount. The graph below is the exact same minus Watson’s full season. It’s a pretty big difference, but it highlights how unlikely it would have been for Watson to continue the streak he was on. Looking at rushing stats, Watson beat almost all of them. He had a high yards per attempt stat, ran for a lot of first downs, and didn’t turn it over. Both Michael Vick and RG3 ran the ball nearly as well, but didn’t secure the ball evidenced by the size of their fumbles. Newton did a good job of getting first downs, but he didn’t have a high yards per attempt. A lot of coaches don’t care how you get the first down so long as you get it, but his low yards per attempt is not sustainable for a rushing quarterback. Part of the reason facing a dual-threat quarterback is so dangerous is because they have that extra home-run threat with their legs. Overall, looking at the comparisons for all of these quarterbacks, Watson seems to rank above everyone in rushing and nearly above everyone in passing. Wilson probably wins there, but not by much. The best part about these comparisons is that Watson did this in such a small sample size. He still has plenty of room to grow and evolve his game. I don’t want anyone to think based on these graphs that he is destined to be a Hall of Famer or either. RG3 had one of the best rookie seasons of any of those guys and is struggling to find work. There is no linear path to greatness, but Watson certainly has set himself up well for it.


 Upgrade Your Experience!
Unlock premium boards and exclusive features (e.g. ad-free) by upgrading your account today.
Upgrade Now!


