This Week in ACC Football |
AROUND THE ACC
Terps Friedgen ties UNC's Dooley for second-best start in ACC history Maryland's Terps are 5-0 for the first time since 1978 and in sole possession of first place in the ACC. The Terps' Ralph Friedgen is the first Terp coach to open his first season 5-0 ... Friedgen's 5-0 is tied for the second-best start by a first-year head coach in ACC history. Fast Starts
Head Coach, School Year Start
Whose's turn is it?
When Wake Forest and Duke play one another this Saturday in Durham it
will mark the 82nd meeting in a long and colorful rivalry that dates
back to the series' first meeting in spring of 1889 ... the two teams
have split the last 14 meetings (dating back to 1972) in Duke's Wallace
Wade Stadium, with each team winning every other meeting.
Deacons-Devils in Wallace Wade


(1972-1999)

Year	Winner	Score


2001	??


1999	Duke	48-35


1997	WF	38-24


1995	Duke	42-26


1992	WF	28-14


1990	Duke	57-20


1988	WF	35-16


1986	Duke	38-36


1984	WF	20-16


1982	Duke	46-26


1980	WF	27-24


1978	Duke	3-0


1976	WF	38-17


1974	Duke	23-7


1972	WF	9-7
Thursday, October 11
#20 Maryland (5-0, 3-0)
at #15 Georgia Tech (4-1, 1-1)
ESPN, 7:30 p.m.
Bobby Dodd Stadium (41,942)
THE GAME: The 14th renewal of a series between these two
nationally-ranked teams will be televised nationally by ESPN ... this
year's game marks the fourth time since 1995 that the two teams have met
in a Thursday night ESPN game ... Tech has won four in a row and leads
the series 10-3 ... the Jackets are 6-0 against the Terps in Bobby Dodd
Stadium.
BY THE NUMBERS: Thursday's game marks the first time that the Terps and
Yellow Jackets have played each other as ranked teams.
THE COACHES: George O'Leary is 49-29 in his seventh year at Tech ...
Ralph Friedgen is 5-0 in his first season with the Terps.
TERPITUDES: The Terps are 5-0 for the first time since 1978 and in sole
possession of first place in the ACC ... with a 143-yard effort against
Virginia Saturday, Perry has rushed for 100 yards or more five straight
games ... Perry leads the nation in rushing (164.2) and is sixth in
all-purpose yardage (198.8) ... WR Guilian Gary has caught a pass in 16
straight games and leads the team in receptions (24) and yards (359) ...
after intercepting only one pass in his first three seasons, senior DB
Tony Okanlawon leads the ACC and is second nationally with four
interceptions in five games (.80) ... over his last three games QB
Shaun Hill has thrown for 651 yards and three TDs.
BUZZ BITS: PK Luke Manget kicked four PATs in Tech's 37-10 win at Duke
Saturday, extending his consecutive PAT streak to an ACC-record 113
straight ... Kelly Campbell is eighth on the ACC's career receiving
yardage list (2,570), 10th in career TD receptions (23) and tied for
16th in career receptions (164); needs two more catches to pass Harvey
Middleton as the school's all-time leader in receptions ... TB Joe Burns
is seventh on the school's career rushing list with 1,927 yards and has
scored at least one TD in 11 of his last 13 games ... QB George Godsey
is second in the ACC and is eighth nationally in passing efficiency; has
passed for 200 yards or more in 12 of his last 13 games and two or more
TD passes in 11 of his last 16 starts ... Godsey is sixth on Tech's
career passing yardage list with 4,167 yards .
Saturday, October 13
#1 Miami (4-0, 2-0 Big East)
at #13 Florida State (3-1, 2-1)
ABC, Noon
Doak Campbell Stadium (80,000)
THE GAME: The Hurricanes and Seminoles clash for 45th time in one of the
nation's most colorful and competitive rivalries ... the two teams have
played one another every year since 1969 ... the Seminoles have won four
of the last five meetings but still trail in the series 24-20 ... FSU
has won the last four meetings in Doak Campbell Stadium.
BY THE NUMBERS: Nine of FSU's 24 defeats in the rivalry have been by
four points or less, including six games by one point.
THE COACHES: Larry Coker is 4-0 in his first year as a head coach ...
Bobby Bowden 318-88-4 in 36 years overall, including a 245-56-4 mark in
26 seasons at Florida State.
CANE COPY: The Hurricanes are the nation's No. 1 ranked team in this
week's coaches' polls ... Miami is 23-5 in games played as the nation's
top-ranked team, 26-21 against ranked opponents and 106-49 in games
played on network television ... the Hurricanes have the nation's
second-longest current win streak with 18 straight games ... have
outscored their opponents 97-14 in the first half ... since 1983, Miami
is 146-14 when scoring first ... QB Ken Dorsey has thrown a TD pass in
20 straight games.
NOLE NOTES: FSU has been ranked in every AP poll since the fifth week of
the 1989 season spanning 203 consecutive weeks ... WR Atrews Bell had at
least one catch in 17 straight games ... freshman QB Chris Rix is second
in the ACC and sixth nationally in passing efficiency and second in the
ACC in total offense (243.0); has thrown a TD pass in all four FSU games
this year and is the top-rated freshman nationally in passing efficiency
... FSU's home winning streak of 36 games is the 12th longest in NCAA
history ... FSU's defense has allowed 100 yards or more rushing only
once in the last nine games ... Nick Maddox ran for a career-high 94
yards and two TDs against the Deacs and is the team's leading rusher
with 259 yards ... senior Javon Walker is averaging a league-high 25.2
yards per catch and is second in the ACC and 30th nationally in
receiving yards per game.
Saturday, October 13
#16 Clemson (3-1, 1-1)
at NC State (3-1, 1-1)
JP, Noon
Carter-Finley Stadium (51,500)
THE GAME: If Saturday's 70th renewal of the Tiger-Wolfpack rivalry
follows the pattern of the last three encounters, fans in Raleigh will
be in for an afternoon of offensive fireworks ... the Tigers have won
four of the last six and eight of the last 12 meetings and lead the
series 43-25-1 ... State owns a 10-6 lead in games played in
Carter-Finley Stadium ... the last four meetings have been decided by a
total of 19 points.
BY THE NUMBERS: Over the last three series meetings, the two teams have
combined to average 816.3 yards and 70.3 points per game.
THE COACHES: Tommy Bowden is 18-10 in his third year at Clemson and
36-14 in five seasons overall ... Chuck Amato is 11-5 in his second year
at the helm of the Wolfpack.
TIGER TIDBITS: QB Woodrow Dantzler leads the ACC and is fourth
nationally in total offense (299.5) ... Dantzler needs just 57 yards
rushing to become the first player in ACC history to reach 2,000 yards
rushing and 4,000 yards passing in his career ... Dantzler has had 200
or more yards of total offense in five straight games and in 18 of his
last 23 games ... Travis Zachery is fourth among school career rushing
leaders with 2,749 yards and has scored 34 touchdowns over his last 22
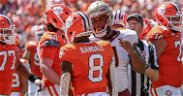
games ... freshman WR Derek Hamilton is third in the ACC and 30th
nationally in receptions per game (5.8); is second nationally among
freshmen in receptions per game.
PACK POINTS: TB Ray Robinson ran for a season-high 90 yards in
Saturday's 17-14 win at Wake Forest ... Robinson is seventh on the
school's career rushing list with 2,320 yards and eighth in all-purpose
yardage (3,179) ... sophomore QB Philip Rivers is sixth on the school' s
passing list (3,988), seventh in total offense (3,890) and tied for
fourth in career TD passes with 30 ... NC State has only three
turnovers in its first four games this season and only 23 turnovers in
15 games the last two years ...... Bryan Peterson had a career-high nine
catches for 86 yards against Wake Forest ... Corey Smith has tied a
school record with six caused fumbles in a season ... the Wolfpack are
the least penalized team in the ACC (56.8).
Saturday, October 13
Wake Forest (2-3, 0-3)
at Duke (0-5, 0-3)
1:00 p.m.
Wallace Wade Stadium (31,500)
THE GAME: The Blue Devils have held the upper hand in this long-time
rivalry that was first contested in the sping of 1889 ... Duke has won
five of the last eight meetings and leads the series 53-26-2 ... three
of the last five meetings have been decided by three points or less ...
the two teams have split the last 14 meetings in Wallace Wade Stadium.
THE COACHES: Jim Grobe is 2-3 in his first season at Wake Forest and
35-36-1 in seven seasons overall ... Carl Franks is 3-24 in his third
season at Duke.
DEACON DETAILS: TB Tarence Williams recorded his sixth career 100-yard
game with 113 yards on 25 carries against NC State ... Williams is
second in the ACC and is 22nd nationally in rushing yards per game
(106.6) ... Wake Forest rushed for 221 yards against NCS and is second
in the ACC and 13th nationally in rushing averaging 229.6 yards per
game , the highest per game average since a 304.0 per game average in
1971 ... over the last two games, senior John Stone has rushed for 156
yards, including 86 yards on 10 carries against the Pack ... Stone is
11th on the ACC's all-time kickoff return yardage list with 1,258 yards
... junior DE Calvin Pace is tied for third on the school's all-time
sacks list with 15.
DEVIL DATA: Chris Douglas is tied with Maryland's Bruce Perry, and is
fifth nationally in all-purpose yardage per game (198.8) - the ACC
single season record for all-purpose yardage is 186.9 yards per game by
Virginia's Frank Quayle in 1968 ... Douglas is fifth in the ACC in
rushing having run for a team-high 394 yards and three TDs ... Douglas
is also third in the ACC in kickoff returns (22.1) and is already 24th
on the ACC's career kickoff return yardage list with 1,231 yards ...
Ronnie Hamilton leads the ACC and is fourth nationally in punt returns
(24.9) ... QB D. Bryant threw for 201 yards against Georgia Tech and is
sixth in the ACC in total offense (190.4) ... TE Mike Hart had two
catches for 65 yards against Georgia Tech extending his consecutive game
streak of catching at least one pass to 17 straight games.
Saturday, October 13
Virginia (3-2, 2-1)
at North Carolina (3-3, 2-1)
1:30 p.m.
Kenan Stadium (60,000)
THE GAME: A full house is expected for this one as two long time rivals
battle for the 106th time in the ACC's most-played rivalry ... the
series is tied for the fifth-most played series in Division I-A history
... the two schools have played one another every season since 1919 ...
the Cavaliers have won three in a row and since 1983 UVa leads the
series 13-4-1, but still trails in the overall series ledger 54-47-4 ...
UNC leads 27-9-3 in games played in Chapel Hill.
THE COACHES: Al Groh is 3-2 in his first year at Virginia and 29-42 in
seven seasons overall ... John Bunting is 3-3 in his first season at UNC
and 41-16 in five years overall ... Groh was the linebackers coach at
UNC from 1973-77.
CAV COPY: Matt Schaub threw for a career-high 271 yards in Saturday's
41-21 loss at Maryland ... as a team, UVa has thrown 11 TD passes this
season, already surpassing the total of eight all of last season ... WR
Billy McMullen had 11 catches for 176 yards and one TD against the Terps
and has at least one TD reception in four straight games ... McMullen
leads the ACC in receptions (7.2), receiving yardage (93.2) and TD
rerceptions (8); is ninth on Virginia's all-time receiving yardage list
with 1,491 yards ... through their first five games, the Cavaliers
have 12 QB sacks after totaling only 15 the entire season a year ago.
HEEL HYPE: Freshman QB Darian Durant has thrown two touchdown passes in
each of his last three games and has set a UNC freshman record with
eight TD passes ... Durant is fifth in the ACC and 36th nationally in
passing efficiency ... DE Julius Peppers has 26 career QB sacks, which
ranks second all-time at UNC and is tied for 10th in ACC annals ...
senior QB Ronald Curry set the school's all-time total offense mark with
5,521 yards and is second in passing yardage (4,464) ... Curry is also
eighth on the ACC quarterback career rushing chart with 1,057 yards ...
. Kory Bailey had six catches for 95 yards against ECU and is sixth on
the school's all-time reception list with 116 catches ... UNC leads the
ACC and is 20th nationally in total defense (290.5).
STATISTICS
2001 Atlantic Coast Conference Individual Statistics Through games of
Oct 08, 2001
RUSHING    	Team	Cl	G	Att	Yds	Avg	TD	Yds/G


Perry, Bruce	MD	SO	5	123	821	6.7	7       164.2


Williams, T	WF	JR	5	125	533	4.3	3       106.6


Burns, J.	GT	JR	5	104	458	4.4	8       91.6


Dantzler, W	CU	SR	4	79	332	4.2	4       83.0


Douglas, C.	DU	SO	5	100	394	3.9	3       78.8


Harris, A.	VA	JR	5	87	363	4.2	1       72.6


Robinson, R.	ST	SR	4	82	272	3.3	3       68.0


Zachery, T	CU	SR	4	69	267	3.9	5       66.8


Maddox, N.	FS	JR	4	48	259	5.4	3       64.8


Ford, S.	GT	JR	5	51	260	5.1	1       52.0

PASSING AVG/GAME        Team	Cl	G	Att	Cmp	Int     Pct.	Yds	TD	Avg/G


Rivers, P.       	ST	SO	4	139	87	1	62.6    944	5	236.0


Godsey, G.      	GT	SR	5	118	78	3	66.1    1115	8	223.0


Dantzler, W       	CU	SR	4	121	79	3	65.3    866	5	216.5


Rix, C.	                FS   	FR	4	83	48	2	57.8	838     7	209.5


Hill, Shaun         	MD	SR	5	137	76	3	55.5    924	6	184.8


Bryant, D.       	DU	JR	5	146	69	4	47.3    919	3	183.8


Spinner, B.        	VA	FR	5	102	60	2	58.8    705	7	141.0


Durant, D.       	NC	FR	6	97	57	6	58.8    690	8	115.0

TOTAL OFFENSE	Team	Cl	G	Rush	Pass	Plays	Total   Yds/G


Dantzler, W	CU	SR	4	332	866	200	1198    299.5


Rix, C.     	FS	FR	4	134	838	113	972	243.0


Rivers, P.	ST	SO	4	-25	944	156	919     229.8


Godsey, G.	GT	SR	5	2	1115	136	1117    223.4


Hill, Shaun	MD	SR	5	41	924	182	965     193.0


Bryant, D.	DU	JR	5	33	919	184	952     190.4


Perry, Bruce	MD	SO	5	821	0	123	821     164.2


Spinner, B.	VA	FR	5	52	705	129	757     151.4


Durant, D.	NC	FR	6	101	690	127	791     131.8


MacPherson, J	WF	JR	5	-4	563	87	559     111.8

RECEPTIONS/GAME	Team	Cl	G	Rec	Yds	TD	Avg/C   Rec/G


McMullen, B.	VA	JR	5	36	466	8	12.9    7.20


Campbell, K.	GT	SR	4	25	371	2	14.8    6.25


Hamilton, D	CU	FR	4	23	233	0	10.1    5.75


Peterson, B.	ST	JR	4	22	304	1	13.8    5.50


Gary, Guilian	MD	SR	5	24	359	3	15.0    4.80


Zachery, T	CU	SR	4	19	161	1	8.5     4.75


Smith, J.	GT	SO	5	21	272	1	13.0    4.20


Robinson, R.	ST	SR	4	16	89	0	5.6     4.00


McKelvey, J	CU	JR	4	15	182	3	12.1    3.75


Bailey, K.	NC	SR	6	21	314	3	15.0    3.50

RECEIVE YDS/GAME	Team	Cl	G	Rec	Yds	TD      Avg/C	Yds/G


McMullen, B.    	VA	JR	5	36	466	8	12.9    93.2


Campbell, K.    	GT	SR	4	25	371	2	14.8    92.8


Justin Walker     	FS	SR	4	13	328	1	25.2    82.0


Peterson, B.    	ST	JR	4	22	304	1	13.8    76.0


Gary, Guilian   	MD	SR	5	24	359	3	15.0    71.8


Hamilton, D     	CU	FR	4	23	233	0	10.1    58.2


Smith, J.       	GT	SO	5	21	272	1	13.0    54.4


Watkins, K.     	GT	JR	5	16	268	4	16.8    53.6


Bailey, K.      	NC	SR	6	21	314	3	15.0    52.3


Mason, T.       	VA	JR	4	14	203	1	14.5    50.8

ALL PURPOSE	Team	Cl	G	Rush	Rcv	PR	KR      Yds	Avg/G


Perry, Bruce	MD	SO	5	821	109	0	64      994	198.8


Douglas, C.	DU	SO	5	394	135	0	465     994	198.8


Campbell, K.	GT	SR	4	1	371	0	221     593	148.2


Robinson, R.	ST	SR	4	272	89	0	109     470	117.5


Mance, B	CU	JR	4	0	0	101	338     439	109.8


Stone, J	WF	SR	5	206	129	0	210     545	109.0


Zachery, T	CU	SR	4	267	161	0	0       428	107.0


Williams, T	WF	JR	5	533	0	0	0       533	106.6


Burns, J.	GT	JR	5	458	67	0	0       525	105.0


Maddox, N.	FS	JR	4	259	64	65	27      415	103.8

INTERCEPTIONS     	Team	Cl	G	Int	Yds	TD	Int/G


Okanlawon, Tony   	MD	SR	5	4	62	0	0.80


Braxton K. Williams	ST	SR	4	3	3	0       0.75


Jackson, Tony   	MD	SR	5	3	1	0	0.60


Pope, K.        	FS	SO	4	2	6	0	0.50


Hafley, C        	CU	SR	4	2	2	0	0.50


Newby,  S.      	VA	JR	5	2	0	0	0.40


McGruder, M         	WF	FR	5	2	0	0	0.40


Peppers, J.      	NC	JR	6	2	42	1	0.33


Tatum, M.         	FS	JR	3	1	0	0	0.33


Washington, J.       	ST	SO	3	1	0	0	0.33

PASS EFFICIENCY	Team	Cl	G	Att	Cmp	Int	Pct.    Yds	TD	Eff.


Rix, C.	        FS	FR	4	83	48	2	57.8	838     7	165.7


Godsey, G.	GT	SR	5	118	78	3	66.1    1115	8	162.8


Spinner, B.	VA	FR	5	102	60	2	58.8    705	7	135.6


Dantzler, W	CU	SR	4	121	79	3	65.3    866	5	134.1


Durant, D.	NC	FR	6	97	57	6	58.8    690	8	133.4


Rivers, P.	ST	SO	4	139	87	1	62.6    944	5	130.1


Hill, Shaun	MD	SR	5	137	76	3	55.5    924	6	122.2


Bryant, D.	DU	JR	5	146	69	4	47.3    919	3	101.4

PUNT RETURN AVG	Team	Cl	G	Ret	Yds	TD	Avg


Hamilton, R.	DU	SR	5	9	183	1	20.3


Mance, B	CU	JR	4	7	101	0	14.4


Allen, B.	NC	JR	6	17	178	0	10.5


Rhino, K.	GT	JR	5	24	239	0	10.0


Pearman, A.	VA	FR	5	15	147	0	9.8


Maddox, N.	FS	JR	4	7	65	0	9.3


Davis, F	WF	JR	5	15	120	0	8.0


Gary, Guilian	MD	SR	5	8	52	0	6.5


Sam, P.K.	FS	FR	3	4	11	0	2.8


Peterson, B.	ST	JR	4	5	11	0	2.2

KICK RETURN AVG	Team	Cl	G	Ret	Yds	TD	Avg


Mance, B	CU	JR	4	12	338	0	28.2


Campbell, K.	GT	SR	4	9	221	0	24.6


Douglas, C.	DU	SO	5	21	465	0	22.1


Robinson, R.	ST	SR	4	5	109	0	21.8


Parson, Rich	MD	FR	4	5	108	0	21.6


Thorpe, C.	FS	FR	4	9	194	0	21.6


Stone, J	WF	SR	5	10	210	0	21.0


Pearman, A.	VA	FR	5	11	227	0	20.6


Knight, K.	NC	JR	6	8	126	0	15.8

PUNTING     	Team	Cl	G	Punt	Yds	Avg


Barnard, Brooks	MD	JR	5	28	1245	44.5


Abrams, M.	VA	SR	5	27	1147	42.5


Gwaltney, C.	FS	JR	4	23	974	42.3


Lafferty, J.	NC	JR	6	43	1717	39.9


Herbert, A.	ST	SO	4	25	940	37.6


McDonald, T.	DU	FR	5	35	1281	36.6

SCORING   	Team	Cl	G	TD	XPT	FG	Pts	Pts/G


Manget, L.	GT	JR	5	0	22	9	49      9.8


McMullen, B.	VA	JR	5	8	0	0	48      9.6


Burns, J.	GT	JR	5	8	0	0	48      9.6


Zachery, T	CU	SR	4	6	0	0	36      9.0


Perry, Bruce	MD	SO	5	7	0	0	42      8.4


Beitia, X.	FS	FR	4	0	16	5	31      7.8


Maddox, N.	FS	JR	4	4	0	0	24      6.0


Dantzler, W	CU	SR	4	4	0	0	24      6.0


Greene, D.	VA	SR	5	0	13	5	28      5.6


Novak, Nick	MD	FR	5	0	16	4	28      5.6

SCORING (TDs)	Team	Cl	G	TD	Rush	Pass	Ret     PAT	Pts	Pts/G


McMullen, B.	VA	JR	5	8	0	8	0       0	48	9.6


Burns, J.	GT	JR	5	8	8	0	0       0	48	9.6


Zachery, T	CU	SR	4	6	5	1	0       0	36	9.0


Perry, Bruce	MD	SO	5	7	7	0	0       0	42	8.4


Dantzler, W	CU	SR	4	4	4	0	0       0	24	6.0


Maddox, N.	FS	JR	4	4	3	1	0       0	24	6.0


Watkins, K.	GT	JR	5	4	0	4	0       0	24	4.8


Riley, Marc	MD	SR	5	4	4	0	0       0	24	4.8


Douglas, C.	DU	SO	5	4	3	1	0       0	24	4.8


Jones, G.	FS	SO	4	3	3	0	0       0	18	4.5

SCORING (KICK)	Team	Cl	G	PATs	FGs	Pts	Pts/G


Manget, L.	GT	JR	5	22-22	9-10	49	9.8


Beitia, X.	FS	FR	4	16-18	5-5	31	7.8


Greene, D.	VA	SR	5	13-13	5-8	28	5.6


Novak, Nick	MD	FR	5	16-17	4-10	28	5.6


Hunt, A   	CU	SO	4	16-16	2-3	22	5.5


Ashe, T 	WF	SR	5	9-10	6-8	27	5.4


Reed, J.	NC	SR	5	13-13	4-7	25	5.0


Herbert, A.	ST	SO	4	4-6	3-3	13	3.2


Garber, B.	DU	SO	5	5-6	2-3	11	2.2


Siljkovic, V.	MD	SR	5	0-2	1-1	3	0.6


FIELD GOALS	Team	Cl	G	FG	FGA	Pct.	FG/G


Manget, L.	GT	JR	5	9	10	90.0	1.80


Beitia, X.	FS	FR	4	5	5	100.0	1.25


Ashe, T 	WF	SR	5	6	8	75.0	1.20


Greene, D.	VA	SR	5	5	8	62.5	1.00


Reed, J.	NC	SR	5	4	7	57.1	0.80


Novak, Nick	MD	FR	5	4	10	40.0	0.80


Herbert, A.	ST	SO	4	3	3	100.0	0.75


Hunt, A 	CU	SO	4	2	3	66.7	0.50


Garber, B.	DU	SO	5	2	3	66.7	0.40


Siljkovic, V.	MD	SR	5	1	1	100.0	0.20

FIELD GOAL PCT	Team	Cl	G	FG	FGA	Long	Pct.


Beitia, X.	FS	FR	4	5	5	40	100.0


Herbert, A.	ST	SO	4	3	3	28	100.0


Siljkovic, V.	MD	SR	5	1	1	44	100.0


Manget, L.	GT	JR	5	9	10	47	90.0


Ashe, T 	WF	SR	5	6	8	37	75.0


Garber, B.	DU	SO	5	2	3	30	66.7


Hunt, A 	CU	SO	4	2	3	45	66.7


Greene, D.	VA	SR	5	5	8	36	62.5


Reed, J.	NC	SR	5	4	7	49	57.1


Novak, Nick	MD	FR	5	4	10	33	40.0

PAT KICKING PCT	Team	Cl	G	Made	Att	Pct.


Manget, L.	GT	JR	5	22	22	100.0


Hunt, A 	CU	SO	4	16	16	100.0


Greene, D.	VA	SR	5	13	13	100.0


Reed, J.	NC	SR	5	13	13	100.0


Novak, Nick	MD	FR	5	16	17	94.1


Ashe, T 	WF	SR	5	9	10	90.0


Beitia, X.	FS	FR	4	16	18	88.9


Garber, B.	DU	SO	5	5	6	83.3


Herbert, A.	ST	SO	4	4	6	66.7


Siljkovic, V.	MD	SR	5	0	2	0.0


2001 Atlantic Coast Conference Individual Statistics Through games of


Oct 08, 2001

TACKLES (All positions)


Player       	Team	Cl	G	Pos	Solo	Ast	Total	Avg/G   Sack


Fisher, L.	ST	SR	4		36	33	69      17.2    0.0


Fowler, R.	DU	SO	5		37	31	68      13.6	2.0


Leake, J	CU	SO	4		25	29	54      13.5	0.0


Crowell, A.	VA	JR	5		39	26	65      13.0	4.0


Hopkins, M	WF	SR	5		32	27	59      11.8	1.0


Henderson, E.J.	MD	JR	5	LB	39	19	58      11.6	1.0


Hafley, C	CU	SR	4	SS	34	11	45      11.2	0.0


Thornton, D.	NC	SR	6		47	18	65      10.8	2.0


Pope, K.	FS	SO	4		24	19	43      10.8	2.0


Duckett, J.	VA	SR	5		31	22	53      10.6	0.0


Carson, C	CU	SR	4	LB	22	20	42      10.5	0.0


Burnette, D.	ST	JR	4		23	18	41      10.2	0.0


Howard, A.	FS	SR	4		26	14	40      10.0	0.0


Small, J.	DU	JR	5		32	15	47      9.4	0.0


Pope, M.	VA	SR	5		26	20	46      9.2	1.5


Monk, Q.	NC	SR	6		31	22	53      8.8	0.0


Jennings, B.	FS	SR	4		19	16	35      8.8	0.5


Brantley, K	WF		5		29	14	43      8.6	1.0


Joe, Leon	MD	SO	5	LB	19	22	41      8.2	1.0


Evans, J.	VA	JR	5		25	14	39      7.8	0.0


Thomas, Rod	CU	JR	4	LB	20	11	31      7.8	1.0


Holt, T.	ST	JR	4		14	17	31      7.8	0.0


Scharrer, J.	DU	FR	4		22	9	31      7.8	0.0


Stamenich, L.	VA	SR	5		17	20	37      7.4	0.0


Fox, K.     	GT	SO	5		24	13	37	7.4     1.0


Reid, D.	NC	SO	6		32	12	44      7.3	1.0


Hood, E.	NC	SR	6		32	12	44      7.3	0.0


Hope, C.	FS	SR	4		21	8	29      7.2	0.0


Wimbush, R.	GT	JR	5		22	13	35      7.0	0.5


Travis Smith	DU	SO	5		28	7	35      7.0	0.0


Jackson, Tony	MD	SR	5	SS	21	14	35      7.0	0.0


Williams, Q	WF	SO	5		26	9	35      7.0	0.0


Mann, R.	VA	SO	5		19	16	35      7.0	0.0


Jamison, B.	ST	SR	4		18	10	28      7.0	2.0


Stanford, K	DU	FR	5		31	2	33      6.6	0.0


Sanders, D.	VA	SR	5		19	13	32      6.4	2.0


Bolling, N	WF	SR	5		20	12	32      6.4	1.5


Meekins, E	CU	JR	4	SAF	13	12	25      6.2	0.0


Muyres, J.	GT	JR	5		20	11	31      6.2	0.0


Dockett, D.	FS	SO	4		11	13	24      6.0	0.0


Williams, B	CU	SR	4		8	16	24      6.0	1.0


Pace, C     	WF	JR	5		16	13	29	5.8     3.0


Kargbo-Okorogie	WF	SR	5		19	10	29      5.8	0.0


Smith, D.	GT	SO	4		15	8	23      5.8	2.0


Thompson, Aaron	MD	SR	5	LB	15	13	28      5.6	3.0


B K. Williams	ST	SR	4		17	5       22	5.5	0.0


Jones, Randall	MD	SR	5		13	14	27      5.4	0.0


Patterson, J.	ST	JR	4		14	7	21      5.2	0.0


Duncan, A	WF	SR	4		13	8	21      5.2	0.0


Chukwumah, O	WF	SO	5		17	9	26      5.2	0.0

SACKS      	Team	Cl	G	Pos	Solo	Ast	Yds	Total   Avg/G


Gathers, G.	GT	JR	5		7	0	43      7.0	1.40


Peppers, J.	NC	JR	6		5	2	38      6.0	 1.00


Crowell, A.	VA	JR	5		4	0	29      4.0	 0.80


Price, S.	ST	JR	4		3	0	22      3.0	 0.75


Johnson,T.	FS	FR	3		2	0	9       2.0	 0.67


Pace, C    	WF	JR	5		2	2	22	3.0      0.60


Thompson, Aaron	MD	SR	5	LB	3	0	21      3.0	 0.60


Curry, A.	VA	SO	5		3	0	17      3.0	 0.60


Smith, C	ST	SR	4		2	0	24      2.0	 0.50


Evans, J.	NC	SR	5		2	1	21      2.5	 0.50

TACKLES FOR LOSS        Team	Cl	G	Pos	Solo	Ast     Yds	Total	Avg/G


Henderson, E.J.  	MD	JR	5	LB	11	1	36      12	 2.40


Gathers, G.     	GT	JR	5		11	1	57      12	 2.40


Bolling, N        	WF	SR	5		10	1	28      11	 2.20


Peppers, J.        	NC	JR	6		10	3	54      13	 2.17


Dockett, D.     	FS	SO	4		8	0	24       8	 2.00


Johnson,T.        	FS	FR	3		6	0	20       6	 2.00


Hopkins, M          	WF	SR	5		6	1	20       7	 1.40


Jackson, A.          	FS	JR	4		5	0	18       5	 1.25


Price, S.         	ST	JR	4		4	1	25       5	 1.25


Joe, Leon         	MD	SO	5	LB	4	2	13       6	 1.20

FUMBLES FORCED	Team	Cl	G	Num


Smith, C	ST	SR	4	6


Monk, Q.	NC	SR	6	3


Collins, C.	GT	JR	5	2


Pace, C	WF	JR	5	2


Travis Smith	DU	SO	5	2


Jones, Randall	MD	SR	5	2


Williams, B	CU	SR	4	2


Fowler, R.	DU	SO	5	2


Gathers, G.	GT	JR	5	2


Bolling, N	WF	SR	5	1

FUMBLES RCVD	Team	Cl	G	Num


Monk, Q.	NC	SR	6	2


Jackson, Tony	MD	SR	5	2


Holt, T.	ST	JR	4	2


Jamison, B.	ST	SR	4	1


Price, S.	ST	JR	4	1


Mooring, I.	NC	SO	6	1


Sims, E.	VA	SR	4	1


Whaley, Mike	MD	SO	5	1


Eason, N	CU	JR	4	1


Hargrove, T.	GT	FR	4	1

PASSES DEFENDED	Team	Cl	G	Brup	Int	Total


Okanlawon, Tony	MD	SR	5	6	4	10


Jackson, Tony	MD	SR	5	6	3	9


Young, C.	GT	SR	5	7	1	8


Peppers, J.	NC	JR	6	5	2	7


McGruder, M	WF	FR	5	5	2	7


Williams, Q	WF	SO	5	6	1	7


Hafley, C	CU	SR	4	5	2	7


Waddell, M.	NC	JR	6	6	0	6


BK. Williams	ST	SR	4	3	3	6


Samuels, S.	FS	SO	4	5	1	6


2001 Atlantic Coast Conference Team Statistics Through games of Oct 08, 2001

SCORING OFFENSE	G	TD	XP	2XP	DXP	FG	Saf  Pts	Avg


Georgia Tech	5	25	22	0	0	9	0    199	39.8


Florida State	4	18	16	0	0	5	1    141	35.2


Maryland	5	23	16	1	0	5	1    173	34.6


Clemson    	4	18	16	0	0	2	0    130        32.5


Virginia	5	14	13	0	0	5	0    112	22.4


NC State	4	11	6	0	0	5	0    87    	21.8


North Carolina	6	17	16	0	0	4	0    130	21.7


Wake Forest	5	11	9	0	0	6	1    95    	19.0


Duke    	5	7	5	0	0	2	0    53         10.6

SCORING DEFENSE	G	TD	XP	2XP	DXP	FG	Saf     Pts	Avg


Maryland	5	8	8	0	0	5	0       71	14.2


NC State	4	8	8	0	0	2	0       62	15.5


Georgia Tech	5	11	9	0	0	1	0       78	15.6


Florida State	4	11	9	0	0	2	0       81	20.2


Virginia	5	14	12	0	0	7	0       117	23.4


Wake Forest	5	16	13	0	0	4	0       121	24.2


Clemson 	4	12	7	0	0	6	0	97      24.2


North Carolina	6	17	13	1	0	8	3       147	24.5


Duke       	5	22	20	0	0	10	0	182     36.4

PASS OFFENSE	G	Att	Cmp	Int	Pct.	Yds	Avg      TD	Yds/G


Georgia Tech	5	146	93	6	63.7	1377	9.4      9	275.4


Virginia	5	177	102	6	57.6	1212	6.8      11	242.4


NC State	4	142	88	1	62.0	947	6.7      5	236.8


Clemson  	4	128	84	4	65.6	942	7.4	 5      235.5


Florida State	4	106	57	2	53.8	929	8.8      7	232.2


North Carolina	6	189	95	11	50.3	1196	6.3      10	199.3


Duke       	5	157	73	6	46.5	946	6.0	 3      189.2


Maryland	5	141	77	3	54.6	933	6.6      6	186.6


Wake Forest	5	110	54	5	49.1	817	7.4      3	163.4

PASS DEFENSE	G	Att	Cmp	Int	Pct.	Yds	Avg      TD	Yds/G


NC State	4	103	55	4	53.4	602	5.8      5	150.5


North Carolina	6	187	91	3	48.7	985	5.3      5	164.2


Georgia Tech	5	145	74	3	51.0	881	6.1      2	176.2


Florida State	4	112	50	6	44.6	746	6.7      4	186.5


Clemson    	4	124	70	2	56.5	776	6.3	 5      194.0


Virginia	5	148	83	6	56.1	999	6.8      4	199.8


Maryland	5	178	100	11	56.2	1034	5.8      4	206.8


Wake Forest	5	143	86	7	60.1	1116	7.8      5	223.2


Duke        	5	161	98	4	60.9	1219	7.6      8       243.8

KICKOFF RETURNS	G	Ret	Yds	TD	Avg


Clemson 	4	17	429	0	25.2


Georgia Tech	5	11	266	0	24.2


Maryland	5	8	191	0	23.9


Duke        	5	26	557	0	21.4


Wake Forest	5	15	309	0	20.6


Florida State	4	12	242	0	20.2


NC State	4	6	120	0	20.0


North Carolina	6	16	312	0	19.5


Virginia	5	15	279	0	18.6

PUNTING  	G	No.	Yards	Avg	Ret	Yds	Avg	Net/P


Georgia Tech	5	13	539	41.5	3	8	0.6     40.8


Maryland	5	28	1245	44.5	14	103	3.7     40.8


Virginia	5	28	1147	41.0	9	53	1.9     39.1


Wake Forest	5	22	839	38.1	11	57	2.6     35.5


Clemson 	4	14	528	37.7	7	42	3.0	34.7


North Carolina	6	44	1714	39.0	23	248	5.6     33.3


NC State	4	25	940	37.6	13	120	4.8     32.8


Florida State	4	24	974	40.6	16	230	9.6     31.0


Duke       	5	37	1281	34.6	27	257	6.9	27.7

                         	Gained	              Lost


TURNOVER MARGIN	G	Fum	Int	Tot	Fum	Int	Tot Mar	Per/G


NC State	4	7	4	11	2	1	3   +8	2.00


Maryland	5	4	11	15	2	3	5   +10	2.00


Georgia Tech	5	7	3	10	1	6	7   +3	0.60


Florida State	4	2	6	8	4	2	6   +2	0.50


Virginia	5	3	6	9	3	6	9   +0	0.00


Wake Forest	5	2	7	9	7	5	12  -3	-0.60


North Carolina	6	9	3	12	6	11	17  -5	-0.83


Clemson  	4	3	2	5	5	4	9   -4  -1.00


Duke    	5	2	4	6	5	6	11  -5  -1.00

RUSHING OFFENSE	G	Att	Yds	Avg	TD	Yds/G


Maryland	5	256	1162	4.5	15	232.4


Wake Forest	5	277	1148	4.1	8	229.6


Clemson  	4	186	768	4.1	12	192.0


Georgia Tech	5	229	923	4.0	15	184.6


Florida State	4	159	577	3.6	9	144.2


Virginia	5	173	619	3.6	3	123.8


North Carolina	6	248	641	2.6	5	106.8


Duke    	5	184	533	2.9	3	106.6


NC State	4	128	384	3.0	4	96.0

RUSHING DEFENSE	G	Rushes	Yards	Avg.	TD	Yds/G


Maryland	5	180	520	2.9	3	104.0


Florida State	4	163	449	2.8	6	112.2


Georgia Tech	5	189	585	3.1	9	117.0


North Carolina	6	208	758	3.6	7	126.3


Wake Forest	5	199	812	4.1	11	162.4


NC State	4	177	653	3.7	3	163.2


Clemson   	4	158	667	4.2	7	166.8


Virginia	5	233	973	4.2	9	194.6


Duke      	5	229	1024	4.5	12	204.8

TOTAL OFFENSE	G	Rush	Pass	Plays	Yards	Avg/P	TD      Yds/G


Georgia Tech	5	923	1377	375	2300	6.1	24      460.0


Clemson 	4	768	942	314	1710	5.4	17	427.5


Maryland	5	1162	933	397	2095	5.3	21      419.0


Wake Forest	5	1148	817	387	1965	5.1	11      393.0


Florida State	4	577	929	265	1506	5.7	16      376.5


Virginia	5	619	1212	350	1831	5.2	14      366.2


NC State	4	384	947	270	1331	4.9	9       332.8


North Carolina	6	641	1196	437	1837	4.2	15      306.2


Duke        	5	533	946	341	1479	4.3	6	295.8

TOTAL DEFENSE	G	Rush	Pass	Plys	Yards	Avg	TD      Yds/G


North Carolina	6	758	985	395	1743	4.4	12      290.5


Georgia Tech	5	585	881	334	1466	4.4	11      293.2


Florida State	4	449	746	275	1195	4.3	10      298.8


Maryland	5	520	1034	358	1554	4.3	7       310.8


NC State	4	653	602	280	1255	4.5	8       313.8


Clemson      	4	667	776	282	1443	5.1	12	360.8


Wake Forest	5	812	1116	342	1928	5.6	16      385.6


Virginia	5	973	999	381	1972	5.2	13      394.4


Duke        	5	1024	1219	390	2243	5.8	20	448.6

PUNT RETURNS	G	Ret	Yds	TD	Avg


Duke      	5	10	186	1	18.6


Clemson   	4	9	116	0	12.9


North Carolina	6	27	331	1	12.3


Georgia Tech	5	27	279	0	10.3


Virginia	5	18	160	0	8.9


Wake Forest	5	16	140	0	8.8


Florida State	4	16	139	2	8.7


Maryland	5	10	73	1	7.3


NC State	4	9	30	1	3.3

PASS EFFICIENCY	G	Att	Cmp	Pct	Int	Yds	TD      Effic


Georgia Tech	5	146	93	.637	6	1377	9       155.0


Florida State	4	106	57	.538	2	929	7       145.4


Clemson 	4	128	84	.656	4	942	5	134.1


Virginia	5	177	102	.576	6	1212	11      128.9


NC State	4	142	88	.620	1	947	5       128.2


Maryland	5	141	77	.546	3	933	6       120.0


Wake Forest	5	110	54	.491	5	817	3       111.4


North Carolina	6	189	95	.503	11	1196	10      109.2


Duke    	5	157	73	.465	6	946	3	95.8


PASS DEF EFFICIENCY	G	Att	Cmp	Int	Pct.	Yds     TD	Effic


North Carolina      	6	187	91	3	48.7	985	5       98.5


Maryland         	5	178	100	11	56.2	1034	4       100.0


Florida State       	4	112	50	6	44.6	746	4       101.7


Georgia Tech          	5	145	74	3	51.0	881	2       102.5


NC State          	4	103	55	4	53.4	602	5       110.7


Virginia         	5	148	83	6	56.1	999	4       113.6


Clemson         	4	124	70	2	56.5	776	5	119.1


Wake Forest         	5	143	86	7	60.1	1116	5       127.4


Duke                 	5	161	98	4	60.9	1219	8	135.9

FIRST DOWNS	G	Rush	Pass	Pen	Total


Georgia Tech	5	51	56	8	115


Maryland	5	70	39	5	114


North Carolina	6	40	54	13	107


Wake Forest	5	61	40	6	107


Clemson   	4	49	48	5	102


Virginia	5	36	56	7	99


Florida State	4	34	39	5	78


Duke     	5	30	38	9	77


NC State	4	22	41	9	72

OPP 1ST DOWNS	G	Rush	Pass	Pen	Total


Florida State	4	24	36	10	70


NC State	4	41	24	9	74


Georgia Tech	5	34	35	8	77


Maryland	5	28	46	6	80


Clemson   	4	36	39	8	83


North Carolina	6	40	43	3	86


Wake Forest	5	50	48	8	106


Virginia	5	53	44	13	110


Duke      	5	55	54	6	115

SACKS BY	G	Sacks	Yards


Georgia Tech	5	21	104


North Carolina	6	17	123


Maryland	5	15	123


Virginia	5	12	66


Wake Forest	5	12	94


NC State	4	10	85


Florida State	4	9	54


Clemson   	4	7	37


Duke      	5	6	31

PENALTIES	G	No	Yds	Avg/G


NC State	4	27	227	56.8


Duke      	5	36	299	59.8


Georgia Tech	5	36	316	63.2


North Carolina	6	50	381	63.5


Maryland	5	33	329	65.8


Clemson         4	30	277	69.2


Wake Forest	5	43	347	69.4


Virginia	5	46	408	81.6


Florida State	4	42	357	89.2

OPP PENALTIES	G	No	Yds	Avg/G


Florida State	4	36	307	76.8


Virginia	5	40	383	76.6


Wake Forest	5	42	382	76.4


NC State	4	40	303	75.8


North Carolina	6	49	436	72.7


Duke     	5	38	346	69.2


Georgia Tech	5	39	289	57.8


Clemson   	4	30	221	55.2


Maryland	5	26	230	46.0

4TH-DN CONVERSIONS	G	Conv	Att	Pct


Clemson         	4	5	6	83.3


Virginia           	5	5	7	71.4


Maryland              	5	4	6	66.7


Wake Forest       	5	8	12	66.7


Georgia Tech      	5	5	9	55.6


Florida State      	4	1	2	50.0


North Carolina       	6	2	6	33.3


NC State         	4	2	7	28.6


Duke                	5	3	13	23.1

OPP 4TH-DN CONVERT	G	Conv	Att	Pct


Florida State      	4	2	8	25.0


Maryland        	5	6	17	35.3


NC State          	4	2	5	40.0


North Carolina      	6	3	7	42.9


Wake Forest       	5	3	6	50.0


Duke             	5	4	7	57.1


Georgia Tech       	5	4	7	57.1


Clemson           	4	5	7	71.4


Virginia              	5	6	8	75.0

RED ZONE OFF	G	RedZone	Percent	TDs	R/P	FG-AT   Fumb/Int/Downs/Other


Florida State	4	13-14	92.9	9	8/1	4-4	0/0/1/0


Virginia	5	16-18	88.9	11	3/8	5-6	0/0/0/1


Georgia Tech	5	22-26	84.6	15	9/6	7-7	0/1/2/1


Clemson  	4	12-15	80.0	12	9/3	0-1	0/1/0/1


North Carolina	6	12-15	80.0	10	4/6	2-3	1/0/1/0


Duke        	5	7-9	77.8	5	3/2	2-3	0/0/1/0


Maryland	5	19-25	76.0	9	6/3	4-7	0/1/2/0


NC State	4	9-12	75.0	5	2/3	3-3	0/0/2/1


Wake Forest	5	12-21	57.1	6	6/0	5-6	3/3/1/1

RED ZONE DEFE	G	RedZone	Percent	TDs	R/P	FG-AT    Fumb/Int/Downs/Other


NC State	4	8-19	42.1	6	3/3	2-4	2/2/4/1


Maryland	5	7-12	58.3	3	1/2	3-4	0/1/3/0


Florida State	4	7-11	63.6	6	5/1	1-2	0/2/1/0


Wake Forest	5	15-20	75.0	10	8/2	4-5	0/2/2/0


Virginia	5	15-19	78.9	9	8/1	6-9	0/1/0/0


Georgia Tech	5	7-8	87.5	6	6/0	1-2	0/0/0/0


Clemson     	4	15-17	88.2	11	6/5	4-5	1/0/0/0


Duke       	5	24-26	92.3	16	11/5	8-8	0/0/1/1


North Carolina	6	16-16	100.0	10	7/3	6-6	0/0/0/0

3RD-DN CONV	G	Conv	Att	Pct


Clemson     	4	35	63	55.6


Georgia Tech	5	37	72	51.4


Maryland	5	35	83	42.2


Florida State	4	23	56	41.1


Wake Forest	5	33	83	39.8


NC State	4	24	62	38.7


Virginia	5	22	69	31.9


North Carolina	6	29	92	31.5


Duke         	5	20	75	26.7

OPP 3RD-DN CONVERT	G	Conv	Att	Pct


North Carolina      	6	26	94	27.7


Maryland        	5	23	83	27.7


Florida State       	4	17	59	28.8


Virginia         	5	23	74	31.1


Georgia Tech        	5	27	78	34.6


NC State           	4	20	56	35.7


Clemson          	4       25	62	40.3


Wake Forest        	5	29	64	45.3


Duke                  	5	38	78	48.7

SACKS AGAINST	G	Sacks	Yards


Georgia Tech	5	7	40


NC State	4	7	45


Wake Forest	5	7	53


Virginia	5	8	63


Maryland	5	9	80


Florida State	4	10	87


Duke        	5	14	86


Clemson       	4	15	75


North Carolina	6	20	140


TIME OF POSS	G	Total	Avg/G


Maryland	5	159:09	31:49


Florida State	4	126:22	31:35


North Carolina	6	186:27	31:04


Georgia Tech	5	154:59	30:59


Wake Forest	5	154:56	30:59


Clemson   	4	121:47	30:26


NC State	4	116:37	29:09


Virginia	5	139:53	27:58


Duke         	5	135:42	27:08

KICKOFF COV	G	No.	Yds	TD	Avg


Wake Forest	5	7	135	0	19.3


Clemson    	4	12	236	0	19.7


Georgia Tech	5	26	523	0	20.1


Virginia	5	16	332	0	20.8


Florida State	4	21	503	0	24.0


Duke       	5	7	171	0	24.4


Maryland	5	16	404	1	25.2


NC State	4	14	370	0	26.4


North Carolina	6	21	567	1	27.0


STANDINGS


                        Conference  Points          Overall   Points

  Team                    W  L  T  For Opp   Pct    W  L  T  For Opp  Pct


  Maryland............    3  0  0   91  48 1.000    5  0  0  173  71  1.000


  Florida State.......    2  1  0  112  78  .667    3  1  0  141  85  .750


  Virginia............    2  1  0   78  75  .667    3  2  0  112 117  .600


  North Carolina......    2  1  0   65  41  .667    3  3  0  130 147  .500


  Georgia Tech........    1  1  0   81  57  .500    4  1  0  199  78  .800


  Clemson.............    1  1  0   71  70  .500    3  1  0  130  97  .750


  NC State............    1  1  0   26  31  .500    3  1  0   87  62  .750


  Wake Forest.........    0  3  0   58  92  .000    2  3  0   99 121  .400


  Duke................    0  3  0   33 123  .000    0  5  0   53 182  .000
 Upgrade Your Account
Unlock premium boards and exclusive features (e.g. ad-free) by upgrading your account today.
Upgrade Now