|
Replies: 25
| visibility 622
|
All-In [47795]
TigerPulse: 100%
Posts: 44515
Joined: 9/5/02
|
willful voter suppression
Jan 10, 2022, 1:55 PM
|
|
unvaxxed dying from covid are willfully suppressing the GOP vote.
|
|
|
|
 |
Rock Defender [53]
TigerPulse: 90%
Posts: 35
Joined: 11/30/98
|
Re: willful voter suppression
Jan 10, 2022, 2:01 PM
|
|
|
|
|
|
|
|
Rock Defender [53]
TigerPulse: 90%
Posts: 35
Joined: 11/30/98
|
Justice Sotomayor is that you?
Jan 10, 2022, 2:08 PM
|
|
|
|
|
|
|
|
|
|
All-TigerNet [13017]
TigerPulse: 100%
Posts: 14035
Joined: 11/2/15
|
Re: willful voter suppression
Jan 10, 2022, 2:01 PM
|
|
They are giving the ultimate, to combat climate change. What are the libs doing? Flying around the world talking about climate change? Figures.
|
|
|
|
|
|
Oculus Spirit [93609]
TigerPulse: 100%
Posts: 95384
Joined: 12/25/09
|
Doesn't seem that the dead care much about voting.
Jan 10, 2022, 2:11 PM
|
|
Why wouldn't the people who want others to live just to vote go ahead and cast a vote in their names? I mean, that's not just something I thought up after the fact, is it?
|
|
|
|
|
|
Oculus Spirit [97673]
TigerPulse: 100%
Posts: 64811
Joined: 7/13/02
|
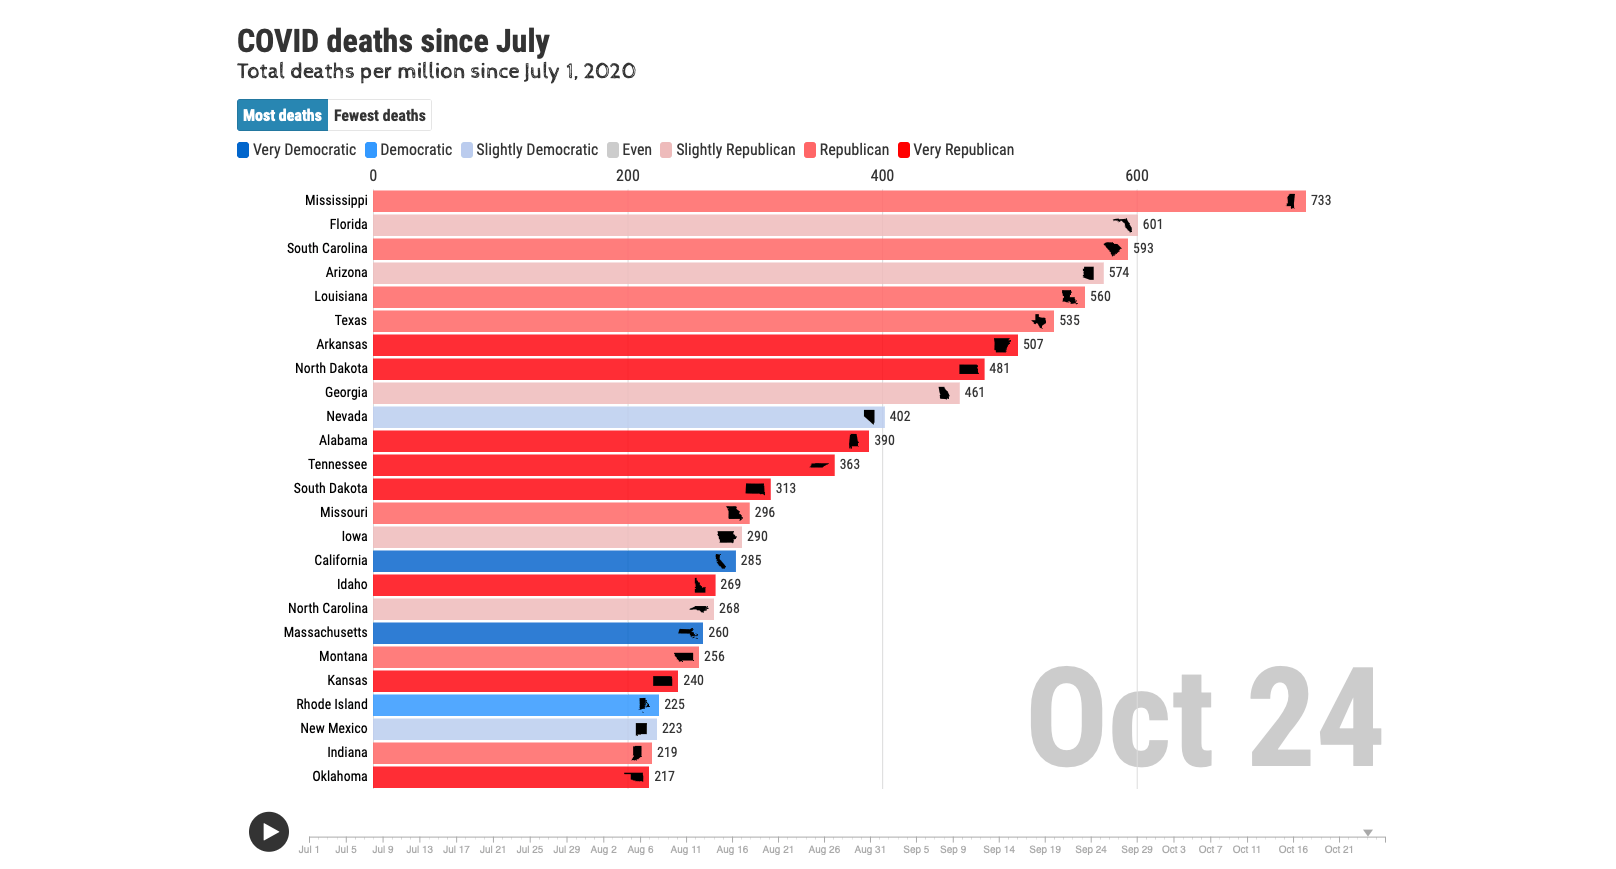
Interesting chart/graphic showing voter suppression
Jan 10, 2022, 2:23 PM
|
|
At least the suppression you are mentioning.
It's a timeline showing just how covid has evolved to be political.
https://dangoodspeed.com/covid/total-deaths-since-july
***Click the link to see the animation.
Message was edited by: Tiggity®
|
|
|
|
|
|
Legend [15730]
TigerPulse: 100%
Posts: 17365
Joined: 2/1/99
|
That is an interesting graph. On the other hand, Worldometer
Jan 10, 2022, 2:37 PM
|
|
shows total deaths per million (I think it's in total, not just from 7/1/2020?) and shows New Jersey as the 4th highest, New York as the 6th highest, Michigan at 10, Massachusetts at 11, Rhode Island as 13 and Pennsylvania at 14.
https://www.worldometers.info/coronavirus/country/us/ United States Coronavirus update with statistics and graphs: total and new cases, deaths per day, mortality and recovery rates, current active cases, recoveries, trends and timeline.
|
|
|
|
|
|
Hall of Famer [20518]
TigerPulse: 100%
Posts: 11668
Joined: 10/15/02
|
Re: That is an interesting graph. On the other hand, Worldometer
Jan 10, 2022, 2:49 PM
|
|
The animated chart started July 2020 whereas the WorldMeter chart is for the entirety of the crisis, I think. That might explain the discrepancy because the big cities (and especially New York/New Jersey) got clobbered hard early.
|
|
|
|
|
|
Rock Defender [53]
TigerPulse: 90%
Posts: 35
Joined: 11/30/98
|
Re: That is an interesting graph. On the other hand, Worldometer
Jan 10, 2022, 2:51 PM
|
|
|
|
|
|
|
|
All-In [34100]
TigerPulse: 100%
Posts: 33600
Joined: 9/13/99
|
|
|
|
|
|
Rock Defender [53]
TigerPulse: 90%
Posts: 35
Joined: 11/30/98
|
Conveniently incomplete data***
Jan 10, 2022, 2:52 PM
|
|
|
|
|
|
|
|
Legend [15730]
TigerPulse: 100%
Posts: 17365
Joined: 2/1/99
|
I think it depends on the story you're trying to tell with
Jan 10, 2022, 3:09 PM
[ in reply to So someone's got fake data here?*** ] |
|
the data.
If for some reason you felt like 7/1/2020 represented a time after which we had a clear understanding of protocols necessary to reduce the impact of the disease, or treatments to manage it better in the hospital, that might be of interest? Or maybe the program only let the creator put a finite number of data points in, so he couldn't go farther back. In any event, in terms of total impact to a state's population, the total impact seems to be the more appropriate data set.
Doesn't really matter...just wanted to point out the nuances to make sure we are clear on what we were looking at.
|
|
|
|
|
|
All-In [34100]
TigerPulse: 100%
Posts: 33600
Joined: 9/13/99
|
But even just the most recent months...
Jan 10, 2022, 3:12 PM
|
|
didn't they have different answers for which states had the most deaths per million?
|
|
|
|
|
|
Legend [15730]
TigerPulse: 100%
Posts: 17365
Joined: 2/1/99
|
The creator's justification can be found if you go back
Jan 10, 2022, 3:44 PM
|
|
to his "Cases by state" graph that is linked below the "Deaths by state" graph Tiggity provided:
"June 1 was chosen as it was around that time that countries worldwide that had been sucker-punched months before had the opportunity to apply proven preventative measures. It also provided an opportunity to contrast the resulting data with states' political affiliations, using the Cook Partisan Voting Index."
So he picked 6/1/2020 as the time we had this thing figured out and moves the "deaths" graph forward a month since deaths is obviously a lagging statistic to cases.
That justification is, of course, debatable. Plus, one must account for the fact that a virus that rips through New York like a fireball for the first half of 2020 will possibly slow down due to the build up of antibodies, and deaths of vulnerable citizens, prior to his 7/1 date.
If the data after 7/1/2020 doesn't line up, I didn't know that. Just pointing out the obvious discrepancy. I do know that Worldometer sites its sources, and this graph is somewhat lacking in that regard (or I couldn't find it), so there is that.
|
|
|
|
|
|
All-In [34100]
TigerPulse: 100%
Posts: 33600
Joined: 9/13/99
|
Ohhh, I see, thanks.
Jan 10, 2022, 3:54 PM
|
|
I was missing the fact that they were showing cumulative totals and not a total new deaths on a specific date. Thanks for helping me out.
|
|
|
|
|
|
Rock Defender [53]
TigerPulse: 90%
Posts: 35
Joined: 11/30/98
|
|
|
|
|
|
All-In [42023]
TigerPulse: 100%
Posts: 38173
Joined: 11/30/98
|
Tiggity already explained this well
Jan 10, 2022, 3:36 PM
[ in reply to I think it depends on the story you're trying to tell with ] |
|
Everything shut down in the early months. Once Memorial Day weekend came, several states opened back up and tried to act like life needed to get back to normal.
The July 1 date isn't cherrypicking. That's when we started to see the splits among states on how to handle it.
|
|
|
|
|
|
Legend [15730]
TigerPulse: 100%
Posts: 17365
Joined: 2/1/99
|
Fair but as I state above, is that necessarily apples to
Jan 10, 2022, 3:47 PM
|
|
apples? I mean, if NY has been ravaged by the disease prior to summer of 2020, it stands to reason that it might slow down after that just by the natural ability of a virus to spread if it has already infected a significant number of people.
|
|
|
|
|
|
All-In [42023]
TigerPulse: 100%
Posts: 38173
Joined: 11/30/98
|
I might agree with that...
Jan 10, 2022, 3:53 PM
|
|
If I didn't see this chart play all the way out. If you haven't, watch it. As time progresses past vaccinations and as the national average drops on it, it becomes pretty clear there's no excuse for this.
|
|
|
|
|
|
Oculus Spirit [97673]
TigerPulse: 100%
Posts: 64811
Joined: 7/13/02
|
Well, that is the start date. NY, and particularly NYC, was
Jan 10, 2022, 3:21 PM
[ in reply to That is an interesting graph. On the other hand, Worldometer ] |
|
hit VERY hard initially. Between March and June of 2020, NY had as many covid deaths as they have since then. Then again it didn't become political for several months. Probably why it begins when it does. That's when we split up responses.
|
|
|
|
|
|
Rock Defender [53]
TigerPulse: 90%
Posts: 35
Joined: 11/30/98
|
Re: Well, that is the start date. NY, and particularly NYC, was
Jan 10, 2022, 4:34 PM
|
|
|
|
|
|
|
|
Rock Defender [53]
TigerPulse: 90%
Posts: 35
Joined: 11/30/98
|
|
|
|
|
|
Oculus Spirit [97673]
TigerPulse: 100%
Posts: 64811
Joined: 7/13/02
|
Before June of 2020 everyone had a similar response.
Jan 10, 2022, 3:32 PM
|
|
SC and Florida were just as shut down as NYC when this started. Everyone was on the same page. Kinda like 9/11. Governor Desantis was stopping people at the border on the interstate highways for crying out loud. Turning people back if from NY/Connecticut, or wherever covid was bad. And he kept travel restrictions and quarantine requirements in place until August of 2020.
So if you want to chronicle the politics playing a role, they didn't until later.
|
|
|
|
|
|
Rock Defender [53]
TigerPulse: 90%
Posts: 35
Joined: 11/30/98
|
Re: Before June of 2020 everyone had a similar response.
Jan 10, 2022, 4:36 PM
|
|
|
|
|
|
|
|
All-TigerNet [13017]
TigerPulse: 100%
Posts: 14035
Joined: 11/2/15
|
Re: Interesting chart/graphic showing voter suppression
Jan 10, 2022, 5:31 PM
[ in reply to Interesting chart/graphic showing voter suppression ] |
|
The chart points out how the state as a whole leans? Who cares. I’m sure Mississippi has lots of black folks that voted Biden, were anti-vax, and died. Where is that broken down?
You guys act like if a state has less lockdowns that people can’t still lock themselves down, double mask, see no one, etc. It’s called personal choice.
Collective ignorance is the real pandemic.
|
|
|
|
|
|
All-In [47677]
TigerPulse: 100%
Posts: 30384
Joined: 11/15/99
|
They'll be voting demo in November.***
Jan 10, 2022, 3:47 PM
|
|
|
|
|
|
|
|
Replies: 25
| visibility 622
|
|
|